Potential Energy Diagrams Study Guide
INTRODUCTION
Have you ever looked at trees and wondered if the branches at the canopy would fall faster than the branches near the ground? That is because the former has more potential energy than the latter.

POTENTIAL ENERGY DIAGRAMS
The change in potential energy in a chemical reaction could be plotted on a potential energy diagram, and we can depict these changes in a potential energy graph.
ENDOTHERMIC REACTION & EXOTHERMIC REACTION
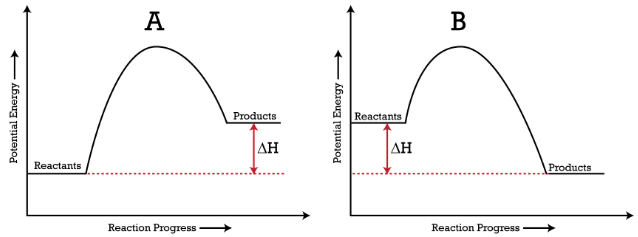
In the figure below, you can see energy diagrams of (A) Endothermic reaction(B) Exothermic reaction
Here, (ΔH) denotes the change in enthalpy.
Enthalpy, normally denoted H, is a thermodynamic property; it is equal to the sum of the internal energy plus the product of the pressure and the volume.
Endothermic reactions have a positive (ΔH), whereas exothermic reactions have a negative (ΔH), as shown in this figure:
Here, the whole potential energy declines as it releases the energy to the surrounding environment.
READING ENERGY DIAGRAMS – ENDOTHERMIC GRAPH AND EXOTHERMIC GRAPH
In the above figure, you can interpret the energy diagrams as:
(A) In the endothermic reaction graph, the energy of resultant products is more than reactants (ΔH is a positive enthalpy change). Here, the total potential energy rises as energy is absorbed from the surrounding environment.
(B) In the exothermic reaction graph, the energy of the resulting products is less than reactants (ΔH is a negative enthalpy change). Here, the total potential energy declines as it releases energy.
ACTIVATION ENERGY DIAGRAM
The highest point of the curve between reactants and products in the potential energy diagram shows you the activation energy for a reaction. When particles react, they must have enough energy to collide to overpower the barrier.
Activation Energy Diagram:
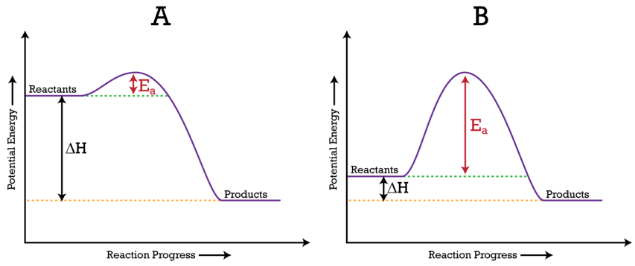
Here, the activation energy is denoted by (Ea).
(A) Ea is lower, as there is a downward dip implying the reaction is quick.
(B) Ea is higher, implying the reaction is quite slow.
Continue your learning journey
Learn about Potential Energy
Learn about Kinetic Energy
CONCLUSION:
- You can depict changes in the potential energy of a system in a potential energy diagram.
- Graphs of both endothermic and exothermic reactions and how to read them have been discussed.
- Explanation of diagram of activation energy on how the process works.
FAQs:
1. How do you read an energy diagram?
Potential energy diagrams can be read from the X-axis to the reaction line. Dashed lines on the graph visualize the potential energy in the graph.
2. What does an energy diagram tell you?
An energy diagram shows whether a reaction is endothermic or exothermic, the potential energy of the reactants and products, and the change in energy for such a reaction.
3. Is delta H negative for exothermic?
Yes, delta H is negative in the graph of an exothermic reaction.
We hope you enjoyed studying this lesson and learned something cool about Potential Energy Diagrams! Join our Discord community to get any questions you may have answered and to engage with other students just like you! Don’t forget to download our app to experience our fun VR classrooms – we promise it makes studying much more fun! 😎
SOURCES:
- Potential Energy Diagrams. https://www.ck12.org/c/chemistry/potential-energy-diagrams/lesson/Potential-Energy-Diagrams-CHEM/. Accessed 17 Feb 2022.
- Potential Energy Diagrams. https://chem.libretexts.org/Bookshelves/Introductory_Chemistry/Introductory_Chemistry_(CK-12)/18%3A_Kinetics/18.04%3A_Potential_Energy_Diagrams#:~:text=A%20potential%20energy%20diagram%20shows,reactants%20are%20converted%20into%20products.&text=The%20activation%20energy%20for%20a,the%20reactants%20and%20the%20products. Accessed 17 Feb 2022.