Heating or Cooling Curves Study Guide
INTRODUCTION
If we want to melt a block of ice, we must raise the temperature above 0 degrees celsius, which is the freezing point of water and can be achieved by supplying heat. You will notice that the ice keeps absorbing heat until the molecules become very excited, which results in melting.
If heat is continued to be supplied to the container, then after a while, the liquid in the container will disappear altogether and transform into gas because excessive absorption of heat will cause the temperature to rise above 100 degrees celsius. Now, various questions arise from these phenomena, which is why we attempt to answer a few questions that students are often faced with.
HEAT CURVE
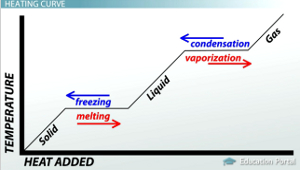
When the process of melting begins, the temperature remains constant, even though heat is constantly being supplied. This is because the energy absorbed during the melting process is equal to the energy released during the same. Thus, no change in temperature is observed. If this phenomenon is mapped on a graph, the result is known as a heat curve diagram.
WHAT HAPPENS TO THE TEMPERATURE DURING MELTING?
When the process of melting begins, the temperature remains constant, even though heat is constantly being supplied. This is because the energy absorbed during the melting process is equal to the energy released during the same.
WHAT DOES A HEATING AND COOLING CURVE DENOTE?
A graph that denotes heating and cooling curves will portray an exponentially increasing value of temperature with the application of heat. Only at certain points will there be a recording of constant temperature. This implies that those values are the melting or freezing and boiling or cooling temperatures of a certain substance.
FAQs
1. What is the heating curve?
When the process of melting begins, the temperature remains constant, even though heat is constantly being supplied. Thus, no change in temperature is observed. If this phenomenon is mapped on a graph, the result is known as a heat curve diagram.
2. How do you use a heating and cooling curve?
A graph that denotes heating and cooling curves will portray an exponentially increasing value of temperature with the application of heat. This implies that those values are the melting or freezing and boiling or cooling temperatures of a certain substance. The heating and cooling curve for water will always have the same value of melting and boiling point for different sources of water. Thus, the heating cooling curve is extremely useful in determining the melting and boiling points of different substances.
3. What is the cooling curve method?
If the process of melting is reversed, the resultant curve is a cooling curve. When heat is taken out of the system, which holds water vapor, the temperature gradually drops. A constant record of temperature gives us the cooling temperature where the vapor changes to its liquid form, while further minimization of heat will give us the value of the freezing point for the water cooling curve.
4. How do you read a cooling curve?
The reading of a cooling curve is achieved in the same way as a labeled heating curve where the constant value of temperatures give us the values of the cooling and freezing points of a particular substance.
We hope you enjoyed studying this lesson and learned something cool about Heating and Cooling Curves! Join our Discord community to get any questions you may have answered and to engage with other students just like you! Don’t forget to download our app to experience our fun VR classrooms – we promise it makes studying much more fun! 😎
SOURCES:
- Heating and Cooling Curve: https://www.ck12.org/c/chemistry/heating-and-cooling-curves/lesson/Heating-and-Cooling-Curves-CHEM/. Accessed 28 Feb 2022.
- Heating and Cooling Curves (also called Temperature Curves): https://courses.lumenlearning.com/cheminter/chapter/heating-and-cooling-curves-also-called-temperature-curves/. Accessed 28 Feb 2022.