Reading a Phase Diagram Study Guide
INTRODUCTION
Have you ever thought about water condensing on the outside of a chilled glass? Or how hot steam turns to water when it settles down on a surface? 🤔
A pure substance typically has three phases or three physical states – solid, liquid, and gas. For example, a cube of ice floating in a glass of water is present in solid and liquid phases.

READING A PHASE DIAGRAM
To define a phase diagram, it is the graphical depiction of the different physical conditions of a given substance under different effects of temperature and pressure. The following diagram shows the phases of water.
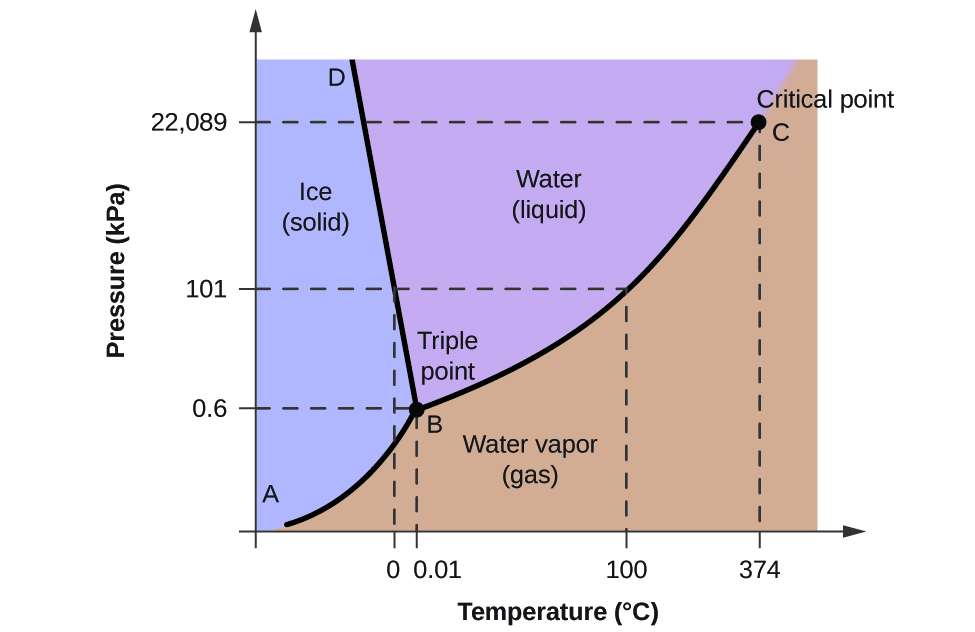
When temperature increases while keeping the pressure constant, solids change into liquids. The line that separates the solid and liquid phases shows the effect of pressure on the substance’s melting point.
TRIPLE POINT PHASE DIAGRAM
When temperatures increase further, liquids change into gas, which is the substance’s boiling point. The critical point is the top limit of the liquid-vapor curve where the critical temperature and critical pressure meet. Beyond the critical point, the vapor will condense to form liquid again, a process called condensation.
If the temperature increases by keeping the pressure constant, the solid turns directly into vapor without going through the liquid stage. This process is called sublimation, and if the pressure rises above the “T” point, the solid will turn into liquid again. Sublimation must occur below the “T” point or the Triple point, where all the three phases are in equilibrium with one another, and the three lines meet. Hence it is called the “Triple Point.”
HOW TO INTERPRET PHASE DIAGRAMS
You can read the normal melting and boiling points from the phase diagram. The melting point and boiling point can be read if you draw a line across at 1 atmosphere.
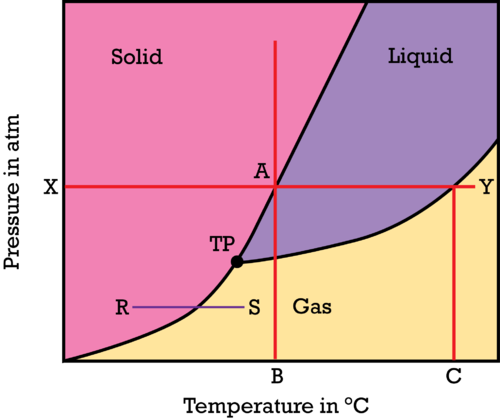
In the above diagram, point B will be the normal melting point, and C is the boiling point of a substance at 1 atmosphere (X).
CONCLUSION:
- Sublimation occurs when a substance changes from a solid into a gaseous state.
- Deposition occurs when a substance changes from a gaseous into a solid-state.
FAQs:
1. What can you determine from a phase diagram?
A phase diagram can explain the melting point, normal boiling point, critical point, and triple point of a given substance. It can also determine the condensation, vaporization, and sublimation temperatures.
2. How do you read the phase diagram of water?
Unlike other substances, the solid/liquid phase line slopes towards the left in the phase diagram for water since water as a liquid is denser than a crystalline solid. So ice can directly change into a liquid by increasing the pressure and not necessarily the temperature.
3. How do you read a metal phase diagram?
In the iron-carbon phase diagram, the resulting alloy formed is steel when the carbon amount is from 0.008% to 2.14%. But cast iron is formed if the carbon content is taken above 2.14%. Both have different physical properties, in that, while steel is smoothly textured and durable, cast iron is brittle and therefore not so lasting.
4. What is ferrite in a phase diagram?
Ferrite is a carbon iron alloy that is a softer phase than the others, like cementite, a hard and brittle phase.
We hope you enjoyed studying this lesson and learned something cool about the Reading a Phase Diagram. Join our Discord community to get any questions you may have answered and to engage with other students just like you! Don’t forget to download our app to experience our fun VR classrooms – we promise it makes studying much more fun! 😎
SOURCES:
- Phase Diagrams. https://www.ck12.org/c/chemistry/phase-diagrams/lesson/General-Phase-Diagram-CHEM/. Accessed 18 February 2022.
- Phase Diagrams.https://chem.libretexts.org/Bookshelves/Physical_and_Theoretical_Chemistry_Textbook_Maps/Supplemental_Modules_(Physical_and_Theoretical_Chemistry)/Physical_Properties_of_Matter/States_of_Matter/Phase_Transitions/Phase_Diagrams. Accessed 18 February 2022.
- Iron-Carbon Phase Diagram Explained. https://fractory.com/iron-carbon-phase-diagram. Accessed 18 February 2022
- The 3 Phases. http://web.mit.edu/10.213/oldpages/f99/diagrams/phase/3phases/index.html Accessed 18 February 2022