Vapor Pressure and Temperature Graph Study Guide
Introduction
We have all seen our mother making tea or coffee in the kitchen. The first thing for making tea is to boil the water. Boiling the water can be done by anyone, but if we challenge you to boil water faster, how will you do it?
You can increase the heat by turning the knob of the stove to increase the flame or the second and most efficient thing is to close the lid of the container to boil the water faster. The pressure that will build up in the container will help to increase the speed of boiling.
WHAT DOES A HIGH BOILING POINT MEAN?
A high boiling point measures the temperature at which a liquid boils. Similar to the melting point, a higher boiling point implies greater intermolecular forces and thus less vapor pressure.
VAPOR PRESSURE CURVE
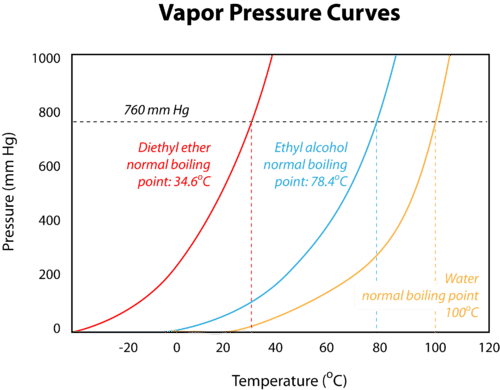
- The temperature vs. vapor pressure graph is created to monitor the different boiling points of different liquids.
- Through the vapor pressure curves, it is evident that different liquids have their different boiling points.
- There is a standard pressure according to which a horizontal line is drawn which signifies the pressure.
- The boiling point of liquids shows the formation of strong intermolecular forces.
- Hence, from the temperature vs. vapor pressure graph, we will get imf (Intermolecular Force) and vapor pressure.
VAPOR PRESSURE FORMULA
First method: Raoult’s law for vapor pressure is as follows:
Psolution = Xsolvent * Psolvent
Where,
- Psolution = Vapour Pressure of the solution
- Xsolvent = mole fraction of solvent
- Psolvent = vapor pressure of the pure solvent
Second method: you can use the Clausius-Clapeyron equation:
ln(P1/P2) = (ΔHvap/R)((1/T2) – (1/T1))
Where,
- ΔHvap: The enthalpy of vaporization of the liquid.
- R: The real gas constant, or 8.314 J/(K × Mol).
- T1: The starting temperature.
- T2: The final temperature
- P1 and P2: The vapor pressures at the temperatures T1 and T2, respectively.
FAQS:
1. What is the relationship between temperature and vapor pressure?
With the increase in temperature of a liquid, the molecules start moving faster. This results in the formation of gas, causing more vapor pressure. Thus, the temperature is directly proportional to vapor pressure.
2. How do you read a vapor pressure-temperature graph?
Since temperature and vapor pressure are directly proportional to each other, their corresponding graph will be a straight line graph.
3. Which of the graph tells the relationship between boiling point and vapor pressure?
If the vapor pressure is high, it implies that the intermolecular forces are low. Thus, high temperature is not required resulting in a low boiling point. Since vapor pressure and boiling point are inversely proportional to each other, their corresponding graph will be hyperbola in shape.
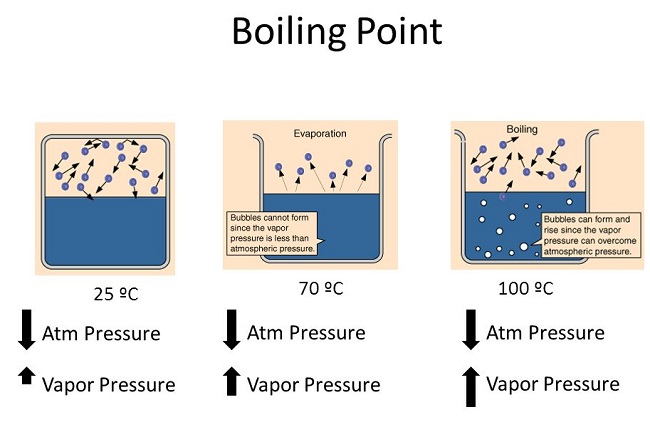
4. What is the relationship between the boiling point vapor pressure and temperature of a substance and atmospheric pressure?
The boiling point is recorded at that time when the vapor pressure of a liquid matches the atmospheric pressure. Thus, if the temperature is increased, the boiling point decreases, but the vapor pressure and atmospheric pressure increase.
We hope you enjoyed studying this lesson and learned something cool about Vapour Pressure and Temperature Graph! Join our Discord community to get any questions you may have answered and to engage with other students just like you! Don’t forget to download our App to experience our fun VR classrooms – we promise it makes studying much more fun!😎
SOURCES:
- Calculate Vapour Pressure: https://www.wikihow.com/Calculate-Vapor-Pressure. Accessed 7th March 2022.
- Vapour Pressure Curves: https://www.ck12.org/c/chemistry/vapor-pressure-curves/lesson/Vapor-Pressure-Curves-CHEM/. Accessed 7th March 2022.