Population Overview and Structure Study Guide
Introduction:
In simple terms, population refers to the total number of organisms in a group. The human population can be studied as discrete units or as a number as a whole.
- The scientific study of the population is called demography.
- It entails studying how the numbers originate, what keeps them stable and what causes them to decline.
The characteristics of the population depend on several factors, which will be explained in detail in this guide.
What is a Population?
-
The definition of population is a collection of entities with similar characteristics with the goal of data collection and analysis.
-
Population refers to the species of organisms present in a particular geographical location and have the capacity to reproduce and grow or maintain their numbers.
-
The population can be further divided into local population and metapopulation.
1. A local population refers to the group of individuals collected in a small space or scattered over a large area and makeup all the individuals of the species.
2. A metapopulation is small groups of individuals of one local population scattered among others.
Demography
The scientific study of different aspects of population is called demography. Populations have demographic attributes that are detailed below.
Birth and Death Rates
- Because a population is a group of individuals with similar characteristics, its health can be measured by the birth and death rates.
- Birth and death rates are statistically calculated to know if the population is maintaining a healthy number.
- The birth rate in human populations is calculated as the number of live births per thousand individuals in a year.
- The death rate is the number of deaths per thousand individuals yearly.
Sex Ratio
- The sex ratio is the number of males in the population to females.
- It is also represented as the number of females per thousand males in human populations.
- The sex ratio indicates healthy births in the population and equality between the sexes.
Age Distribution
- Every population consists of individuals of varying ages.
- As a significant demographic factor, the age distribution measures individuals in different stages of the reproductive phase, such as pre-reproductive, reproductive, and post-reproductive groups.
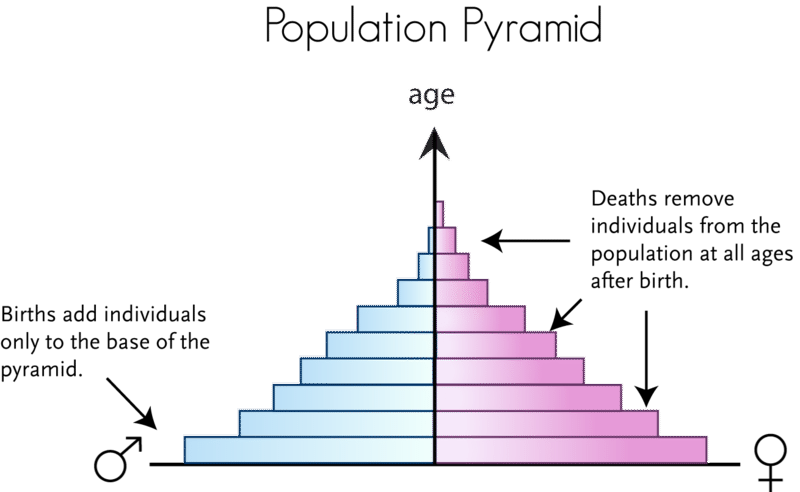
- It is graphically represented as a pyramid and shows whether a population is stable, growing, or declining. For example: Children (below 15): Both unproductive economically and in reproduction. They need to be provided food, shelter, education, and other basic needs. Working Population (15-59 years): These individuals can work and reproduce to maintain the population numbers. Aged Population (over 59 years): They may still be working, but they cannot reproduce. Population Density: The population density measures the individuals present per unit area of a given habitat. It is an indicator of the ability of the environment to provide the necessary resources.
Population Pyramids
One of the most important representations of understanding demographic features is population pyramids. These are graphs that give the age-sex distribution of the population for a given frame of time. Population pyramids are in three types:
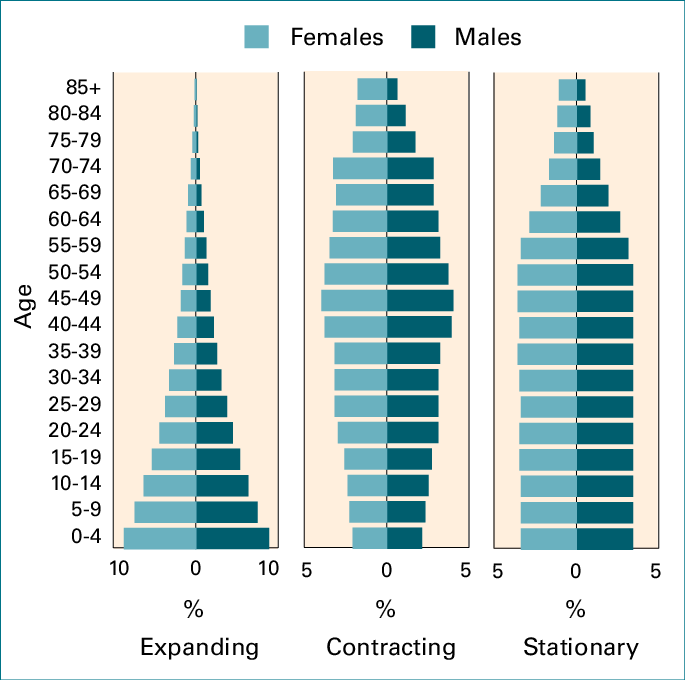
Expansive Pyramid:
The expansive pyramid is found in populations with a strong and healthy growth rate. Each level in the pyramid indicates a different age group. When the fertility and birth rates are high, the base of the pyramid is strong, and the structure is strongly triangular. As we go up to the top, it indicates the aging population and lesser life expectancy and numbers.
Constrictive Pyramid:
Constrictive pyramids indicate lesser numbers of young population and higher older people. It could be because of low birth rates and higher life expectancy in the older population. This is the opposite of the expansive pyramid and indicates fewer birth rates than death rates.
Stable Pyramid:
The stable pyramid is a rectangle indicating steady population numbers across all age groups. A small taper at the top might indicate a slightly increased death rate among the elderly. Stable pyramids indicate steady birth rates, and the life expectancy is higher because of better facilities.
Conclusion:
A population is a group of individuals with identifiable characteristics living in the same geographical location to breed and maintain their numbers. Populations have various attributes such as birth and death ratio, sex ratio, age distribution, and population density.
FAQs:
1. What is population structuring?
Population structuring refers to the composition of a population with respect to age, sex, and other demographical attributes. The density, sex, and age are three structures of a population.
2. What are the types of population structure?
There are 3 types of structures in the concept of population:
- Expansive
- Constrictive
- Stationary
3. What is population composition and structure?
Population composition describes the various attributes of the group, such as sex, age, education, marital status, relationship in the household, and occupation.
4. How can we study population structure?
Population structure can be studied using sampling methods to get estimates of mortality, natality, and dispersal.
5. What is population structure in sociology?
The population structure, represented as a pyramid, shows how the individuals in different age groups are doing in terms of birth and death rates.
6. What are the characteristics of the population?
The important characteristics of a population are:
- Size and density
- Dispersion or distribution
- Age structure
- Birth rates (natality)
- Death rates (mortality)
7. What composes a population?
A population is a given number of individuals in a group that live in the same geographical area at the same time. They should have the capacity for breeding to maintain or increase their numbers.
We hope you enjoyed studying this lesson and learned something cool about the Population Overview and Structure! Join our Discord community to get any questions you may have answered and to engage with other students just like you! Don’t forget to download our App to experience our fun, VR classrooms – we promise, it makes studying much more fun! 😎
Sources:
- Population Structure. https://flexbooks.ck12.org/cbook/ck-12-biology-flexbook-2.0/section/6.18/primary/lesson/population-structure-bio/. Accessed 3 Dec, 2021.
- Population composition and characteristics. https://www.open.edu/openlearncreate/mod/oucontent/view.php?id=79927§ion=5. Accessed 3 Dec, 2021.
- Population Structure. https://www.sciencedirect.com/topics/earth-and-planetary-sciences/population-structure#:~:text=Whereas%20population%20structure%20can%20be,population%20processes%20(Southwood%201978). Accessed 3 Dec, 2021.